Cicor Group
Annual Report 2023
Letter to the Shareholders
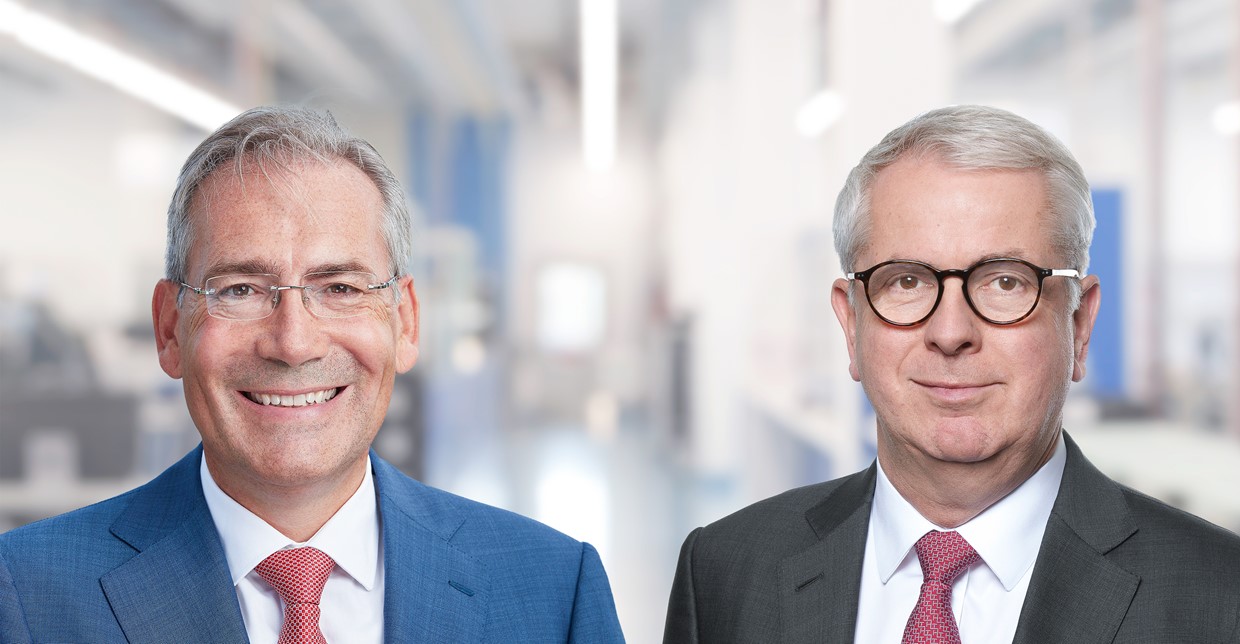
“The consistent execution of Cicor’s business strategy is reflected in new record figures for order intake, sales and profitability.”
Alexander Hagemann, CEO
)
Focus on sustainability
With the latest sustainability report, Cicor provides comprehensive information on minimizing environmental impact, promoting employees and productivity, and creating value beyond the business. Cicor thereby applies the standards of the Global Reporting Initiative (GRI).
)
About Cicor
The Cicor Group is a globally active provider of full-cycle electronic solutions from research and development to manufacturing and supply chain management. Cicor’s approximately 2,700 employees at 17 locations are serving leaders from the medical, industrial and aerospace & defence industries. The shares of Cicor Technologies Ltd. are traded at the SIX Swiss Exchange (CICN).
Key Figures
CHF 389.9million
Net sales from deliveries and services
24.5%
Sales growth compared to previous year
11.6%
EBITDA margin
CHF399.8million
Order intake
84%
Sales were generated in the strategic target markets of medical technology, industry, as well as aerospace and defense
2551
Cicor employees as of December 31, 2023